Profiling in python
I’ve been wanting to start writing little notes here and there for useful tidbits I’ve found in my work over the years and somehow never get around to it. Work, or life, or excessive social plans mean all my notes stay in incomprehensiblely long work-related txt files detailing also minutiae of meeting notes, requirements for changes, drafts of replies I want to make on slack. I don’t really condense nuggets from small “aha this is helpful” moments into a post.
As I’m coming off a break from work (and currently 4 weeks deep into looking after a very energetic and time-consuming Shiba Inu puppy) I’m going to try and carve out some time for it in between stopping him chewing the sofa vs stopping him chewing my clothes.
The thing in python we often first learn for understanding how long something takes is probably the time or timeit modules. They’re a great starting point and useful for benchmarking particular functions or methods.
Adding something like this to a general utilities area in your team I’ve found to be helpful for local debugging as you can customise messages or specific counters you’re interested in:
1
2
3
4
5
6
7
8
9
10
11
12
13
14
import time
import functools

def timer(func):
    @functools.wraps(func)
    def wrapper(*args, **kwargs):
        tic = time.perf_counter(), time.process_time()
        value = func(*args, **kwargs)
        toc = time.perf_counter(), time.process_time()
        elapsed_time_real = toc[0] - tic[0]
        elapsed_time_cpu =  toc[1] - tic[1]
        print(f"------------timer------------\nCall: {func.__name__}\nReal time: {elapsed_time_real:0.4f} secs\nCPU time: {elapsed_time_cpu:0.4f} secs")
        return value
    return wrapper
Then you can sprinkle this around some code when you’re checking out a problem. Below I’ve (shamelessly) copied a public solution to the Sieve of Eratosthenes (having lost my own Project Euler attempt of it) and we can try invoking the timer.
1
2
3
4
5
6
7
8
9
10
11
12
13
14
def sieveOfEratosthenes(num):
    results = set()
    prime = [True for i in range(num+1)]
    p = 2
    while (p * p <= num):
        if (prime[p] == True):
            for i in range(p * p, num+1, p):
                prime[i] = False
        p += 1
    for p in range(2, num+1):
        if prime[p]:
            results.add(p)

sieveOfEratosthenes(1000000)
Now, we could run this multiple times and get an output something like this:
1
2
3
4
5
6
7
8
9
10
11
12
13
14
------------timer------------
Call: sieveOfEratosthenes
Real time: 0.0687 secs
CPU time: 0.4665 secs

------------timer------------
Call: sieveOfEratosthenes
Real time: 0.0813 secs
CPU time: 0.6701 secs

------------timer------------
Call: sieveOfEratosthenes
Real time: 0.0776 secs
CPU time: 0.7469 secs
But why do that when we can use timeit and specify the iterations, thereby getting a better benchmark?
1
2
3
4
5
import timeit

iters = 100
total_time = timeit.timeit(stmt='sieveOfEratosthenes(1000000)', number=iters, globals=globals())
print(total_time/iters)
Now you can also make this into a decorator to apply around your code, but if you’re looking at a body of code there’s better things you can use to give you a breakdown of what’s called and the time it takes up.
cProfile is really lovely. Using this we can see that a lot of the time is taken up via the list comprehension and most of it is the overhead of literally calling the function. This kind of stuff becomes way more interesting in a more complex example.
1
2
3
4
5
6
7
8
9
10
11
12
from cProfile import Profile
from pstats import SortKey, Stats
from sieveOfEratosthenes import sieveOfEratosthenes

with Profile() as profile:
    sieveOfEratosthenes(1000000)
    (
         Stats(profile)
         .strip_dirs()
         .sort_stats(SortKey.CUMULATIVE)
         .print_stats(50)
    )
The resulting output is great and you can save it other than just printing to the CLI.
1
2
3
4
5
6
7
8
9
10
11
12
13
14
15
16
78508 function calls in 0.128 seconds

   Ordered by: cumulative time

   ncalls  tottime  percall  cumtime  percall filename:lineno(function)
        1    0.106    0.106    0.133    0.133 sieveOfEratosthenes.py:1(sieveOfEratosthenes)
        1    0.024    0.024    0.024    0.024 sieveOfEratosthenes.py:3(<listcomp>)
    78498    0.003    0.000    0.003    0.000 {method 'add' of 'set' objects}
        1    0.000    0.000    0.000    0.000 pstats.py:108(__init__)
        1    0.000    0.000    0.000    0.000 pstats.py:118(init)
        1    0.000    0.000    0.000    0.000 pstats.py:137(load_stats)
        1    0.000    0.000    0.000    0.000 cProfile.py:51(create_stats)
        1    0.000    0.000    0.000    0.000 {built-in method builtins.len}
        1    0.000    0.000    0.000    0.000 {built-in method builtins.isinstance}
        1    0.000    0.000    0.000    0.000 {built-in method builtins.hasattr}
        1    0.000    0.000    0.000    0.000 {method 'disable' of '_lsprof.Profiler' objects}
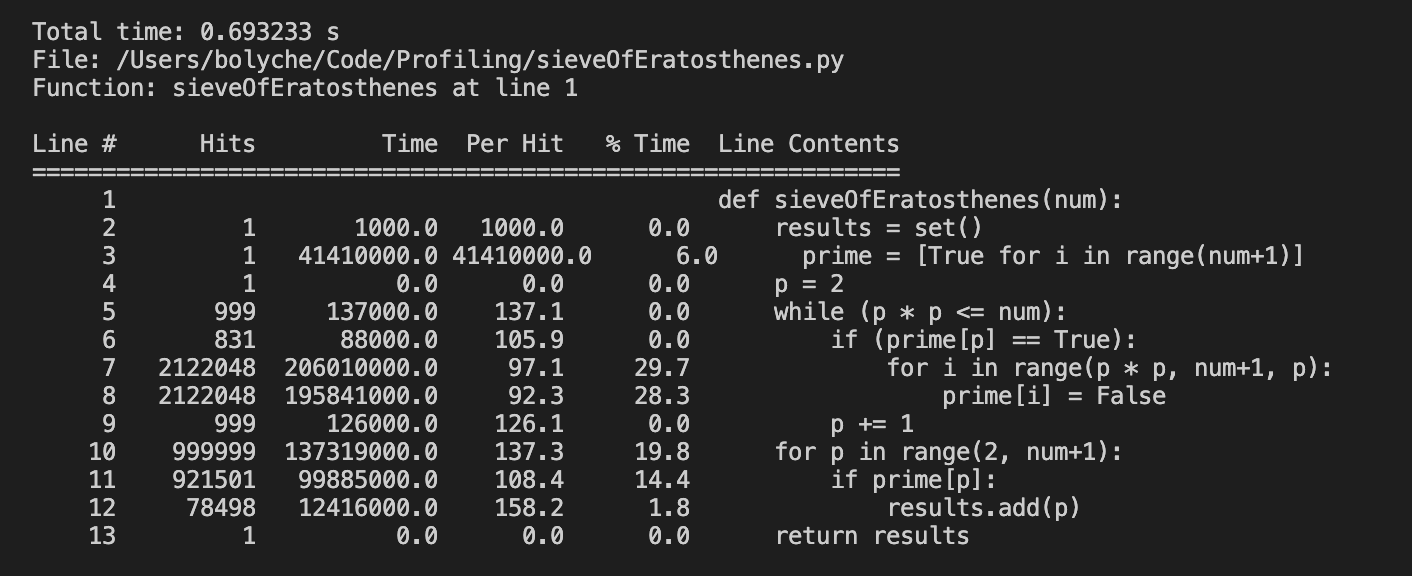
There are sophisticated tools out there nowadays - line_profiler can in some ways be better than cProfile given it accounts for time spent on special methods. The output is also particularly neat with the % time breakdown per line.
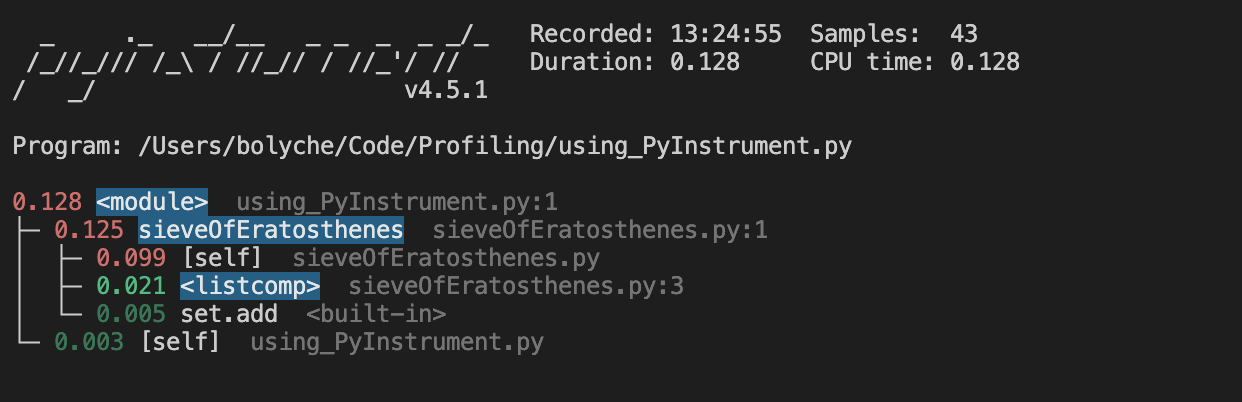
Pyinstrument is one I’ve not used in my actual work but it’s lauded as a good statistical profiler. I can imagine the ability to drill down into function calls in a large codebase would be useful (with my example not being detailed enough to warrent it).
Although the hot news in python is the more recent perf profiler available on Linux, the note I’m ending this post on is actually going to be Scalene. That’s largely yes, because I haven’t had a chance to test perf and also because I’d need to spin up a VM to do so (aka, I am anticipating a future post).
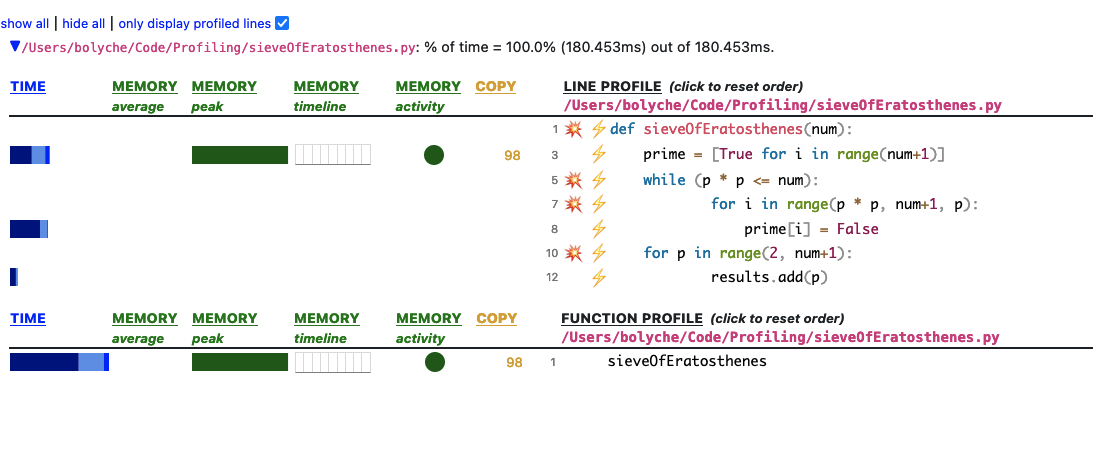
Scalene is very fun. It’s statistical (low overhead, not deterministic like cProfile), & as well as showing the CPU and time it shows memory allocation growth per line of code. Something I also appreciate is that it distinguishes between libraries - so native code you’re importing or using written in C or C++ will show up as native in the GUI vs python code you could potentially be improving. The profiler results are just really nice, too. It ouputs a handy html & json file you can interact with in your browser or save elsewhere.
1
2
3
4
5
6
from scalene import scalene_profiler
from sieveOfEratosthenes import sieveOfEratosthenes

scalene_profiler.start()
sieveOfEratosthenes(1000000)
scalene_profiler.stop()
I haven’t enabled the OpenAI GPT improvements they offer yet but it would also be interesting to see what’s suggested. I’ve included a screenshot of what you’ll see below from the profile.html
These examples are all uploaded to my Github here so feel free to use.